Key Data-Driven Accessibility Metrics for Better Progress Tracking and Resource Security
Summarize with:
The world of technology is progressing, and with it, inclusivity is reaching new heights. The Web Content Accessibility Guidelines (WCAG), started in 1999, have focused on making the web perceivable and operable by people with disabilities worldwide. But even then, 95.9% of websites fail to meet web accessibility standards, making it difficult for disabled people to access the internet properly.
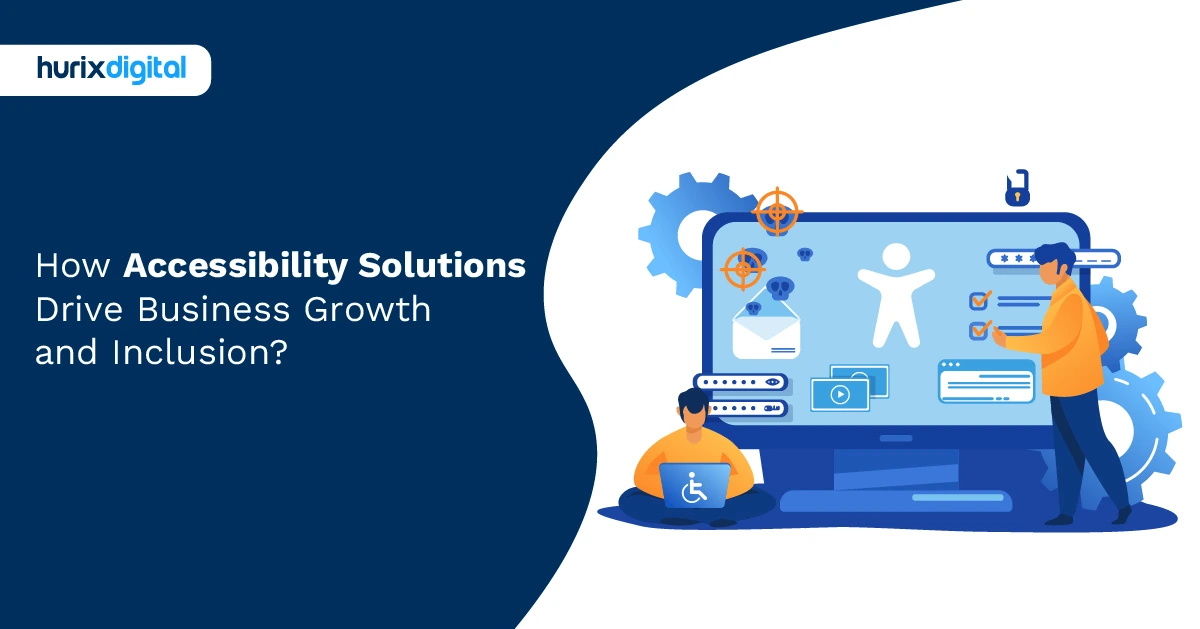
Accessibility is a defining point for every company as it ensures an inclusive digital space for people with disabilities. Data-driven accessibility includes digital tools to make it easy for people with disabilities to browse the internet by removing barriers that can complicate people’s digital journey.
This article discusses the importance of accessibility and how you can use different metrics to measure its success in your company’s system.
Table of Contents:
- Why Do We Need Data-Driven Accessibility?
- Best Metrics and KPIs for Tracking Accessibility Progress for Better Inclusivity
- Wrapping Up
Why Do We Need Data-Driven Accessibility?
Data-driven accessibility ensures that people have a seamless digital experience without encountering obstacles when using the internet. According to World Health Organization (WHO), approximately 1.3 billion people experience significant disability as of 2023.
Today, accessibility compliance has become mandatory, as there are laws that prohibit discrimination based on disabilities. So, it is safe to say that compliance is crucial to avoid legal consequences like expensive lawsuits and use content properly to advocate equal rights.
Let us discuss how you can use accessibility performance indicators to understand how well your systems and websites are adhering to accessibility standards. This can ensure that you do not run into compliance issues and that your systems are diverse and easy to navigate.
Also Read: Best Practices to Ensure Accessibility on Social Media Platforms
Best Metrics and KPIs for Tracking Accessibility Progress for Better Inclusivity
Here are some successful accessibility analytics that can make your system easy to read and interpret.
1. Data-Driven Accessibility User Feedback
Getting people to run tests is a great idea to check data-driven accessibility. This way, you can be sure that people with disabilities are finding your accessibility initiative useful. It can also make it easy to trace problems and better understand your users’ perspectives.
Such testing can help you understand where your system is failing, and you can modify your data accordingly. Use accessibility analytics like survey forms, star ratings, consumer testimonials, and reviews to understand web accessibility issues closely so you can work towards finding the best solutions to solve them.
Make your survey as specific as you want it to be so that you can understand the exact issues and find the best solutions.
2. ROI of Accessibility
If you want to understand how well your content matches web accessibility standards, then return on interest (ROI) is a great performance indicator. Calculating ROI can show you how much your business is making with accessibility compliance.
You can find out the overall money you are investing and the profits you are making with your initiative. You can not only see the overall turnover of your company but also the ROI you are making with each product.
This way, you can understand where your products are failing with detailed growth statistics that show you how your company has progressed with WCAG compliance with your products.
3. Accessibility Error Rate
Analyzing accessibility audit reports for error rates can give great insight into how well your company handles accessibility. In a study, an average of 51.4 distinct accessibility errors per home page were found.
Checking error rates with data-driven accessibility is crucial so you can be sure that your home pages are running well enough. Check for missing alt text, color contrast, and inaccurate HTML usage to look for faults. You can use different accessibility tools to help you in this for fast resolution to reduce error rate and increase user satisfaction.
4. Compliance Level
This is perhaps the most important metric for digital accessibility as it ensures that your data complies with the WCAG or the Americans with Disabilities Act (ADA) rules properly. This ensures that your data adheres to the rules well, making it easy for users, and is Perceivable, Operable, Understandable, and Robust (POUR).
You can ensure that your data is compliant with the help of screen readers or automated compliance checkers. With these tools, you can trace any errors and fix them so you do not fall prey to any legal and reputational consequences.
Some things to look for are high color contrast for easy readability, alternate texts for every visual, and keyboard navigability. Set goals for your data-driven accessibility and see how the level your content achieves (out of A, AA, or AAA).
5. Accessibility Usage Data
Understanding usage patterns with your brand and its products with a proper accessibility audit can be helpful if you are trying to make your content easier to use and perceive. Collect user data so you can get a closer look at how your users are taking advantage of data-driven accessibility in 2024.
Such data can show you patterns, trends, and behavior across users, helping you understand the best data-driven accessibility practices. Use Google Analytics and other tools to track the retention and conversion rates of your homepage. This can give you a clear picture of what is working well and what needs refinement.
Get Your FREE Guide: How to Create an Accessible Brand in 2024 and Beyond?
Wrapping Up
With evolving technology, the standards and functioning of data-driven accessibility are also changing. Keeping up with these changes is important to not only avoid legal consequences but also create inclusive spaces for all types of people.
Increased accessibility can have a positive impact on your company with increased viewer satisfaction and enhanced conversion rates. The metrics mentioned above are only some ways to make your content more user-friendly. Understand your content goals and use these metrics consequently for maximum results and a step forward toward the future.
If you want to make your content more user-friendly with digital accessibility so that people with disability do not run into any issues, use Hurix Digital today. We aim to keep up with trends and ensure your system has the easiest-to-perceive and operate content that increases visibility and readability.
Schedule a call today with our team to know more!
Summarize with:

Vice President – Content Transformation at HurixDigital, based in Chennai. With nearly 20 years in digital content, he leads large-scale transformation and accessibility initiatives. A frequent presenter (e.g., London Book Fair 2025), Gokulnath drives AI-powered publishing solutions and inclusive content strategies for global clients
 A Space for Thoughtful


